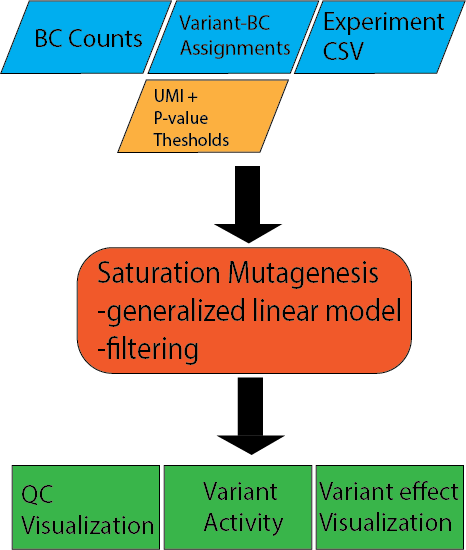
Saturation mutagenesis

Input files
Variant-BC Assignments
The assignment file contains the variants, assigned to each barcode. It can be gzipped and it is set through the option --assignment. Each row starts with one barcode, e.g. AAAAAACTAATACCA. The barcode is followed by multiple variants separated by a space. It can also be possible that a barcode has no variant. Then the barcode stands for the complete reference sequence. A variant has the format identifier:position:ref>alt, e.g. TERT:408:G>A. The identifier will be always the same and is use to mark the target of origin. Here the promoter TERT. The position is usually the position in the target transcript or any other coordinate system. ref is the reference base and alt the alternative base to the original target reference. Both can be a single or multiple nucleotide, e.g. TERT:75:GCCCC>GCCCCC is a valid variant and refers to an insertion of one C after position 79. For deletions a dot (.) can be used in the reference. So TERT:42:G>. is the deletion of the base G at position 42. It can also be written as TERT:41:TG>T.
Example file:
AAAAAACTAATACCA     IRF6:104:A>G IRF6:408:G>A
AAAAAAGCAGGAACA     IRF6:66:A>G IRF6:373:T>A
AAAAAAGCATTCTGT     IRF6:371:G>T IRF6:510:G>A IRF6:560:C>T
AAAAACACTACTGGT     IRF6:326:C>T IRF6:509:T>A
Experiment file
Experiment file list the condition(s), replicate(s) and corresponding count files of the analysis. It is comma separated (without spaces in between) and must be set via --e or --experiment-file.
TERT-GBM,1,TERT-GBM_1_counts.tsv.gz
TERT-GBM,2,TERT-GBM_2_counts.tsv.gz
TERT-GBM,3,TERT-GBM_3_counts.tsv.gz
TERT-HEK,1,TERT-HEK_1_counts.tsv.gz
TERT-HEK,2,TERT-HEK_2_counts.tsv.gz
TERT-HEK,3,TERT-HEK_3_counts.tsv.gz
DNA/RNA counts per barcode
For each condition and replicate count file (gziped) is needed with the number of DNA and RNA counts per barcode. It is tab separated starting with the barcode, followed by the the DNA and then the RNA counts. Count files can be produced by the count workflow. See Count. All count files must be in the --dir folder.
Example file:
AAAAAAAAAATGATAAGGAA    56      29
AAAAAAAAAATGGGAAGGCG    89      112
AAAAAAAAAATTTGCGTAAA    25      32
AAAAAAAAAATTTGCGTAAT    1       1
AAAAAAAAAATTTGGGGATA    5       26
AAAAAAAAACAATAAGAAAT    21      55
AAAAAAAAACCCAGAATACG    31      39
SaturationMutagenesis.nf
Options
With --help or --h you can see the help message.
Mandatory arguments:
--dir Directory of count files (must be surrounded with quotes). --assignment Variant assignment file. --e, --experiment-file Experiment csv file.
Optional:
--outdir The output directory where the results will be saved (default outs). --thresh Minimum number of observed barcodes to retain variant (default 10). --pvalue pValue cutoff for significant different variant effects. For variant effect plots only (default 1e-5).
Processes
Processes run by nextflow in the saturation mutagenesis utility.
- calc_assign_variantMatrix
- Creates the variant matrix for the linear model using only single base pair substitutions (for each condition and replicate).
- calc_assign_variantMatrixWith1bpDel
- Creates the variant matrix for the linear model using single base pair substitutions and 1 bp deletions (for each condition and replicate).
- fitModel
- Fit the matrix (variantMatrix and variantMatrixWith1bpDel) using a generalized linear model (for each condition and replicate).
- summarizeVariantMatrix
Todo
describe summarizeVariantMatrix
- statsWithCoefficient
- Output of the log2 variant effects from the linear model combined with number of barcodes (for each condition and replicate).
- plotCorrelation
- Plots the correlation between replicates of one condition.
- plotStatsWithCoefficient
- Plots the variant effect plot of the target region using all variants larger than the threshold and the significnace level set by
--p-value(for each condition and replicate). - fitModelCombined
- Fit the matrix (variantMatrix and variantMatrixWith1bpDel) using a generalized linear model (for each condition the combined model).
- combinedStats
Todo
describe combinedStats
- statsWithCoefficientCombined
- Output of the log2 variant effects from the linear model combined with number of barcodes (for each condition the combined model).
- plotStatsWithCoefficientCombined
- Plots the variant effect plot of the target region using all variants larger than the threshold and the significnace level set by
--p-value(for each condition the combined model).