Count
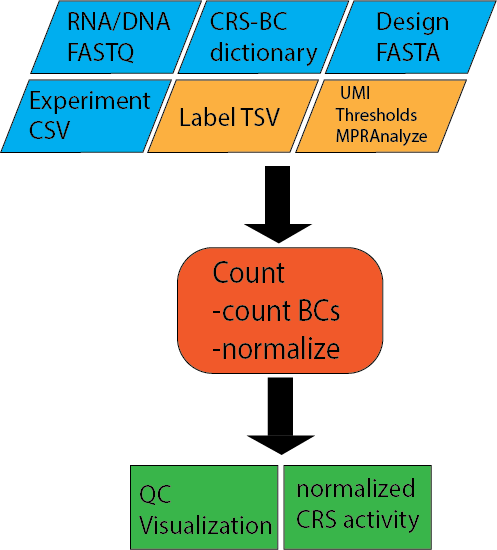
Input files
Experiment File
Comma separated file (CSV) that assigns all fastq files present in a directory to a condidtion and replicate. Each line represents an experiment, which will all be processed in parallel
Condition,Replicate,DNA_BC_F,DNA_UMI,DNA_BC_R,RNA_BC_F,RNA_UMI,RNA_BC_R
Condidtion1,1,C1R1_DNA_barcode_F.fastq.gz,C1R1_DNA_barcode_UMI.fastq.gz,C1R1_DNA_barcode_R.fastq.gz,C1R1_RNA_barcode_F.fastq.gz,C1R1_RNA_barcode_UMI.fastq.gz,C1R1_RNA_barcode_R.fastq.gz
Condidtion1,2,C1R2_DNA_barcode_F.fastq.gz,C1R2_DNA_barcode_UMI.fastq.gz,C1R2_DNA_barcode_R.fastq.gz,C1R2_RNA_barcode_F.fastq.gz,C1R2_RNA_barcode_UMI.fastq.gz,C1R2_RNA_barcode_R.fastq.gz
Condidtion1,3,C1R3_DNA_barcode_F.fastq.gz,C1R3_DNA_barcode_UMI.fastq.gz,C1R3_DNA_barcode_R.fastq.gz,C1R3_RNA_barcode_F.fastq.gz,C1R3_RNA_barcode_UMI.fastq.gz,C1R3_RNA_barcode_R.fastq.gz
Condidtion2,1,C2R1_DNA_barcode_F.fastq.gz,C2R1_DNA_barcode_UMI.fastq.gz,C2R1_DNA_barcode_R.fastq.gz,C2R1_RNA_barcode_F.fastq.gz,C2R1_RNA_barcode_UMI.fastq.gz,C2R1_RNA_barcode_R.fastq.gz
Condidtion2,2,C2R2_DNA_barcode_F.fastq.gz,C2R2_DNA_barcode_UMI.fastq.gz,C2R2_DNA_barcode_R.fastq.gz,C2R2_RNA_barcode_F.fastq.gz,C2R2_RNA_barcode_UMI.fastq.gz,C2R2_RNA_barcode_R.fastq.gz
Condidtion2,3,C2R3_DNA_barcode_F.fastq.gz,C2R3_DNA_barcode_UMI.fastq.gz,C2R3_DNA_barcode_R.fastq.gz,C2R3_RNA_barcode_F.fastq.gz,C2R3_RNA_barcode_UMI.fastq.gz,C2R3_RNA_barcode_R.fastq.gz
Design File
Fasta file of of CRS sequences with unique headers describing each tested sequence
Example file:
>CRS1
GACGGGAACGTTTGAGCGAGATCGAGGATAGGAGGAGCGGA
>CRS2
GGGCTCTCTTATATTAAGGGGGTGTGTGAACGCTCGCGATT
>CRS3
GGCGCGCTTTTTCGAAGAAACCCGCCGGAGAATATAAGGGA
>CRS4
TTAGACCGCCCTTTACCCCGAGAAAACTCAGCTACACACTC
Association Pickle
Python dictionary of CRS to Barcodes
Label File (Optional)
Tab separated file (TSV) of desired labels for each tested sequence
Example file:
CRS1  Positive_Control
CRS2  Negative_Control
CRS3  Test
CRS4  Positive_Control
Count.nf
Options
With --help or --h you can see the help message.
- Mandatory arguments:
--dir Fasta directory (must be surrounded with quotes) --e, --experiment-file Experiment csv file --design Fasta of ordered insert sequences. --association Pickle dictionary from library association process. - Optional:
--labels tsv with the oligo pool fasta and a group label (ex: positive_control), a single label will be applied if a file is not specified --outdir The output directory where the results will be saved (default outs) --bc-length Barcode length (default 15) --umi-length UMI length (default 10) --no-umi Use this flag if no UMI is present in the experiment (default with UMI) --merge_intersect Only retain barcodes in RNA and DNA fraction (TRUE/FALSE, default: FALSE) --mpranalyze Only generate MPRAnalyze outputs --thresh minimum number of observed barcodes to retain insert (default 10)
Processes
Processes run by nextflow in the Association Utility. Some Processes will be run only if certain options used and are marked below.
- create_BAM or create_BAM_noUMI (if no UMI sequence)
- creates a bamfile of barcode and UMI sequences
- raw_counts
- creates a table of counts for each barcode (where UMIs, if present, are deduplicated)
- filter_counts
- Remove barcodes that are not the appropriate length
- final_counts
- Record overrepresended UMIs and final count table
- dna_rna_merge_counts or dna_rna_mpranalyze_merge
- Merge RNA/DNA count matrices per barcode
- final_merge (MPRAnalyze option only)
- Merge all DNA/RNA counts into one file
- final_label (MPRAnalyze option only)
- Label the barcodes
- generate_mpranalyze_inputs (MPRAnalyze option only)
- Generate inputs for MPRAnalyze, counts tables and annotation tables for rna/dna
- dna_rna_merge
- Merge each DNA and RNA file label with sequence and insert and normalize
- calc_correlations
- Calculate correlations between Replicates
- make_master_tables
- Create tables of each CRS normalized across replicates
Output
The output can be found in the folder defined by the option --outdir. It is structured in folders of the condition as
Files
File tree
outdir
  |-Condition
    |-allreps.tsv
    |-average_allreps.tsv
    |-HepG2_1_2_correlation.txt
    |-HepG2_1_2_DNA_pairwise.png
    |-HepG2_1_2_Ratio_pairwise.png
    |-HepG2_1_2_RNA_pairwise.png
    |-HepG2_all_barcodesPerInsert_box.png
    |-HepG2_barcodesPerInsert.png
        |-Reps
            |-HepG2_1_counts.tsv
            |-HepG2_1_counts.tsv.gz
            |-HepG2_1_DNA_counts.tsv
            |-HepG2_1_DNA_raw_counts.tsv.gz
            |-HepG2_1_RNA_filtered_counts.tsv.gz
            |-HepG2_1_DNA_filtered_counts.tsv.gz
            |-HepG2_1_RNA_counts.tsv
            |-HepG2_1_RNA_raw_counts.tsv.gz
Files for each Condition
- allreps.tsv
- TSV of normalized DNA and RNA count, ratio, log2ratio, and number of observed barcodes for each condition, replicate, of every CRS
- average_allreps.tsv
- mean ratio, log2 ratio, and observed barcodes per condidition normalized for all replicates
- HepG2_1_2_correlation.txt
- correlation values for a condition and 2 replicates (ie: HepG2 replicate 1 vs replicate 2)
- HepG2_1_2_DNA_pairwise.png
- Correlation plot of DNA counts condition vs two reps (ie: HepG2 replicate 1 vs replicate 2)
- HepG2_1_2_Ratio_pairwise.png
- Correlation plot of normalized log2(RNA/DNA) condition vs two reps (ie: HepG2 replicate 1 vs replicate 2)
- HepG2_1_2_RNA_pairwise.png
- Correlation plot of RNA counts condition vs two reps (ie: HepG2 replicate 1 vs replicate 2)
- HepG2_all_barcodesPerInsert_box.png
- Box plot of each CRS accross replicates for all barcodes in each condidtion. Colored by the label file.
- HepG2_barcodesPerInsert.png
- Histogram of number of barcodes detected per CRS
- HepG2_group_barcodesPerInsert_box.png
- Boxplot of CRS normalized per insert, grouped by labels
Files for each replicate in each condidtion
- HepG2_1_counts.tsv
- mean ratio, log2 ratio, and observed barcodes per condidition for each replicate
- HepG2_1_counts.tsv.gz
- table of barcodes with DNA counts and RNA counts
- HepG2_1_DNA_counts.tsv
- table of barcodes with DNA counts
- HepG2_1_DNA_raw_counts.tsv.gz
- table of barcodes, UMI, and DNA counts raw
- HepG2_1_DNA_filtered_counts.tsv.gz
- table of barcodes, UMI, and DNA counts raw, filtered for barcodes of correct length
- HepG2_1_RNA_counts.tsv
- table of barcodes with RNA counts
- HepG2_1_RNA_raw_counts.tsv.gz
- table of barcodes, UMI, and RNA counts raw
- HepG2_1_RNA_filtered_counts.tsv.gz
- table of barcodes, UMI, and DNA counts raw, filtered for barcodes of correct length